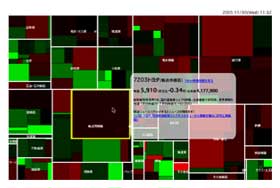
Accordin to Kouki Yamada, who sent me the link, each cell of this Japanese Stock Market Visualizer, shows the status of a company. The colour reflects the price change and the size mirrors the company size. Among the companies represented are Sony, Panasonic and Toyota.

If he receives some requests, Kouki Yamada will buid an English version of the site.
UPDATES: Thanks to Andrew, Michael and Lawrence who pointed me to SmartMoney’s Map of the Market, another visualization tool, developed by Bedersen and Shneiderman at the University of Maryland.
Big thanks to Ben who wrote me about Stock Market Planetarium, a brilliant installation at the Tate Britain, during the Art Now exhibition in 2001.
Lise Autogena and Joshua Portway created a planetarium of stars, each one representing a company and its relative value on the stock market.
Check also Nancy Paterson‘s good old Stock Market Shirt.
