A few weeks ago, and against my better judgment, i stopped by Decode: Digital Design Sensations at the Victoria and Albert in London. The exhibition showcases recent developments in digital and interactive design through three themes: Code, Interactivity and Network.
I have nothing particularly flattering to write about the exhibition. I wish i had done like Furtherfield and visited the Digital Pioneers exhibition instead. The exhibition takes place at the V&A as well but doesn’t benefit from as much advertising as Decode.

In theory, Decode looks like a very glam affair. In reality, it has a bit of a fancy thrift shop feeling with all the works crammed in a confined and confused space. I was left in shock when i saw how little space each work had to breathe while all around me a group of school girls were laughing their way from one work to another, frantically waving their arms/head/some bathroom appliances in all directions in order to trigger some kind of reaction… sorry “interaction” from the works. The code section of the show wasn’t a much more pleasant experience. I had to fight my way through a narrow corridor jam packed with people taking pictures or videos of the strikingly beautiful works on screen. I’m glad the exhibition is such a success. I’d even go as far as confessing that i’m perversely happy that interaction and digital design are being thrown in the direction of the broad public in such an informal way.
Damn! it’s not like me to bad-blog an exhibition like that. Maybe i was not the right audience for that kind of exhibition but then maybe i am because some artists whose work i admire are participating to the show. Stanza is one of them.
As his bio says, Stanza is an expert in arts technology, CCTV, online networks, touch screens, environmental sensors, and interactive artworks. Recurring themes throughout his career include, the urban landscape, surveillance culture and alienation in the city.
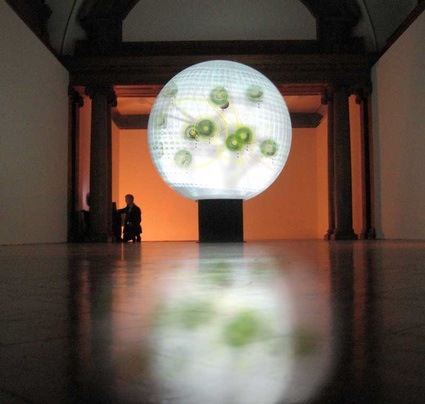
 Sensity on a round globe display tested at County Hall London (Live data on globe 2006). Image copyright stanza
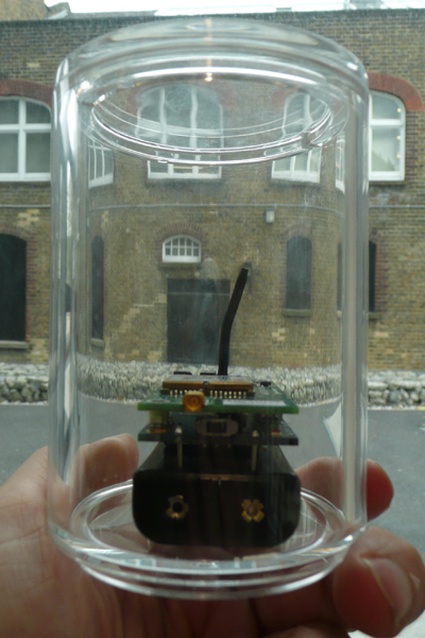
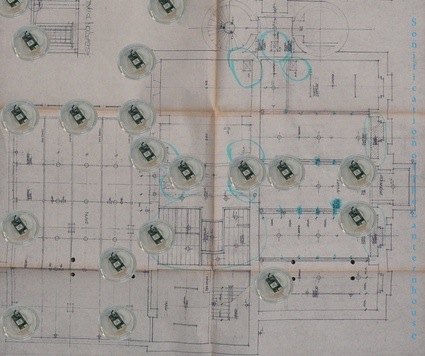
His artworks have won prestigious awards and have been exhibited all over the world, from the Venice Biennale to the Tate Britain, from the State Museum in Novorsibirsk to the Biennale of Sydney. I blogged so often about his work, it’s quite embarrassing. Stanza is exhibiting Sensity at Decode. Some 20 custom made environmental sensors units are distributed in the V & A Porter gallery and around the city of London. They measure, light, noise, sound, humidity, and temperature. The data is turned into a online real time visualisation of the space for everyone, whether they are gallery visitors or city planners, to see and ponder on. Sensity V & A opens up a discourse about networks and surveillance technologies and questioning the social political fabric of the landscape around us (more details and pictures about the V&A version.)
The Decode exhibition wasn’t that bad. After all, it gave me an excuse as good as any other to blog this little interview with Stanza about his work.
How visible are the sensors in the city?
Actually I don’t advertise where they are exactly, they are too expensive to loose. The visability is virtual and presented via its GPS location. All the data is presented online via XML feeds that are open source.
Do you have to keep them hidden lest they get stolen or damaged? How do you select the location of the sensors?
The location is based on the network and the distance apart one can place them so that they still transmit and send data. But you’re right, having them stolen is a big issue since I cannot afford replacement
 Image copyright stanza
Do you need a special authorization to place the sensors and collect the data?
In theory yes, in practice, I don’t. There are more complex issues about security of space and surveillance. In fact because of the potential of this project for larger scale urban monitoring, noise and pollution monitoring in real time I am surprised I haven’t been approached to develop this on a larger scale.
By measuring all sorts of physical data the sensors reveal also some social aspects and variables of the environment. The text that presents Sensity states that “The output from the sensors display the “emotional” state of the city”.
So what is the emotional state of the city?
The condition of change of time represents the emotional state as measured by the varying sensors.
 Image copyright stanza
Do you perceive patterns according to the time of the day for example?
The patterns and shapes in the visualisation are what is being affected by the real time environmental conditions.
Well the time of day affects the patterns that are relayed to the screen.
The sensors have time stamp, light, temperature, humidity, GPS, noise and sounder
What can the ‘general public learn from Sensity?
I want the public to explore new ways of thinking about interaction within public space and how this affects the socialization of space. The project uses environmental monitoring technologies and security based technologies, to question audiences experiences of the event and space and gather data inside the space.
The project also focuses on the micro-incidents of change, the vibrations and sounds of the using these wireless sensor based technologies.
Imagine walking out the door, and knowing every single action, movement, sound, micro movement, pulse, and thread of information is being tracked, monitored, stored, analyzed, interpreted, and logged. The world we will live in seems to be a much bigger brother than the Orwellian vision, its the mother of big brother.
Can we use new technologies to imagine a world where we are liberated and empowered, where finally all of the technology becomes more than gimmick and starts to actually work for us or are these technologies going to control up, separate us, divide us, create more borders. With the securitzation of city space create digital borders that monitor our movement and charge us for our own micro movements inside the system.
The data is also used to create visualizations in an open source environment. Other online users can also re- interpret the data and interrogate the various sensors in the network as this is open sourced as well (xml streams).
How about you?
What I have learnt from mixing the cities and creating mash-ups online with the data from various city set is that there is a new space, a 4^th space, a new world of possibilities.
These works are focused on the wider picture of city experiences which are being played out in real time. This sort of experience of multi nodes and multi threaded spaces, demands a refined gathering of data, a sensitive accumulation which can then lead to some kind of modeling and visualization. [audible and visual (mils)-representation] of the social network as it exists and is impacted upon.
 Image copyright stanza
Do you navigate cities differently after you have submitted them to Sensity?
Within this project no…..and it’s a good question. However within a project like soundcities.com the experience and the relationship to place is different. Soundcities is my online open source database of city sounds from around the world, that can be listened to, used in performances on laptops, or played on mobiles via wireless networks.
The project soundcities is completely made up of found sounds and soundscapes from the thousands of samples I collected.
The sounds of cities also give clues to the emotional and responsive way we interact with our cities. Cities all have specific identities, and found sound can give us clues to the people that inhabit these spaces, as well as provoking us and stimulating our senses in a musical way. Within soundcities the aim is to create an online aural experience that evokes place, both as literal description but also developed musical composition. The sounds of cities evoke memories. So this idea of assent gathering of sounds creates a different feeling that the gathering of data.
With sensity although we are the body in the data space; we again control it but because its on a micro scale it’s harder to relate to. That’s why a project like Sensity is so important.
You’ve installed Sensity in many cities around the world. How is the V&A one different?/
The way Sensity is exhibited can be scaled up and this depends really on the commitment of the host organization.
I now have several version of this artwork.
A local version can be made and then projected and also shown online. I have already made versions for several cities. In this case I test and deploy my sensors and make the visualisation.
Making it real time so sensor data isn’t recorded but real time. This involves set up of technology, adding some code to router, using my sensors, using my computers, set up of the sensors in the correct location, programming them, replacing batteries and care for the duration of the show and insurance. In this case I test and deploy my sensors and make the visualisation and leave the sensors and the computers running all the time.
How it looks in the gallery or the actual displays ie, what it is seen by the audience. It can be experienced on plasma screens, projected or shown on 3d globes. Once the visualisation is made there are a numbers of ways to present it.
The Decode show is a much longer term real time colloborative deployment of my two networks in the gallery and across the city. I can monitor all the sensors remotely tell the gallery to change batteries, etc. The issue is that the V & A and their technical team has to be able to support the technical needs of the work.
What becomes of the data once the show is over?
None of the data as the system is set up is archived…. it’s all real time. I do plan to allow the database to have a history but this now requires further funding and development.
Thanks Stanza!
All text copyright stanza.
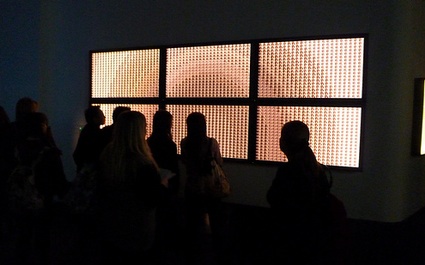
Pictures i took in the Decode exhibition.
Decode: Digital Design Sensations continues until the 11 April 2010 at the Victoria & Albert Museum in London.
