
Most of us don’t really know (nor probably care to know) how “the network” functions, what its structure of communication cables and servers looks like or how, more concretely, our private data travel. Roel Roscam Abbing spent a month at Laboral in Gijón to work on Border Check, a software that lays out the physical and political realities behind the internet.
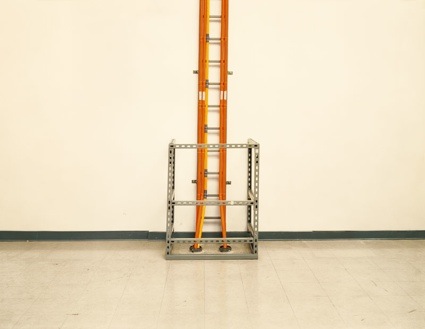 Taryn Simon, Transatlantic Submarine Cables Reaching Land. VSNL International, Avon, N.J.
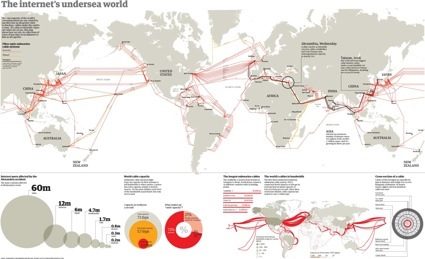 Fibre-optic submarine cable system
And i’m sorry to quote him but in this age of reckless online surveillance even Dick Cheney thinks that you never know how much knowledge you’re going to need. So maybe a good place to start would be to visualize how our data are moving from place to place (and thus which government can potentially have a look through it) and Border Check enables just that:
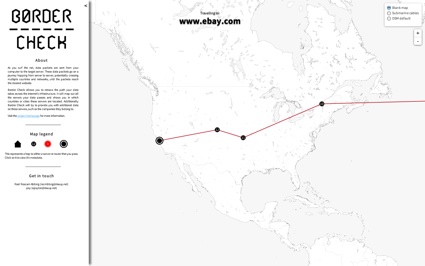
As one surfs the net, data packets are sent from the user’s computer to the target server. The data packets go on a journey hopping from server to server potentially crossing multiple countries until the packets reach the desired website. In each of the countries that are passed different laws and practices can apply to the data, influencing whether or not authorities can inspect, store or modify that data.
Hi Roel! Border Check (BC) is a browser extension that illustrates the physical and political realities of the internet’s infrastructure using free software tools. Why did you think it would be interesting to investigate the travels of data packets?
I stumbled upon this topic when pursuing a personal interest I developed last year as I started with the Networked Media programme at the PZI. I joined this course because my practice has always been engaged with new technologies and the internet. At the same time however, I felt I lacked a lot of knowledge (technical, theoretical) to make statements with and about these media. For one, if someone would have asked me what the internet was, I would not really have had an answer. So one of the first things I started researching while at the PZI was exactly this. What is the internet? It was during the programming courses that I started working with software such as traceroute, which shows you how you connect to servers. Traceroute really fascinated me because suddenly it linked websites to specific machines that could be linked to a company and to a location on the world. This suddenly made the internet very tangible for me.
At the same time while reading up on the history of the internet I realised the difference between how I had previously perceived the internet as a ‘cloud’, ‘wireless’, non-physical (which is probably a more common understanding) and the internet as a bunch of physical cables that run through countries and the bottoms of oceans. Tracerouting then became a way to experience this normally invisible infrastructure.
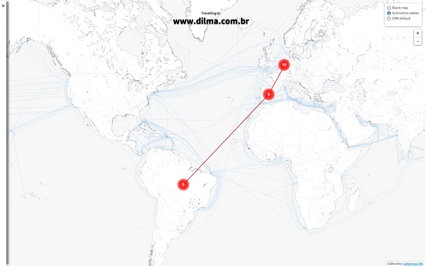 Dilma screenshot
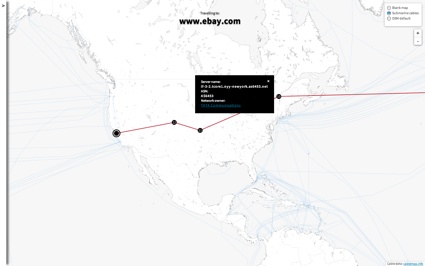 Ebay screenshot
Some of the demo you sent me show the data taking a straight line. In other cases, such as for dilma.com.br, the path is more tortuous. How do you explain this? And is every non-straight path accountable for?
The complexity of the paths has a lot to do with the degree of interconnectivity of the networks. Generally, the better the connection between you and the destination server, the smaller the amount of hops on your travel. So if you see a lot of hops and twisting paths, it is probably because there is no direct connection between you and the destination.
The complexity of the paths can also be the result of certain assumptions embedded in the databases used for the visualisation. One of these assumptions has to do with determining where a machine is located in the world. Sometimes the geographical data tied to a machine’s IP address reflects where it’s owning company is registered, rather than the actual physical location of the machine. So you might get visualisations where you’d see a line travel back and forth between Europe and the US. Rather than actually travelling back and forth the Atlantic, what happens, is that your travel stays in Europe, yet you get on and off networks owned by US and EU companies. Because of this when using BC it’s important to click the hops to reveal the machine names, often they contain more hints of where the machines may be actually located.
In this sense BC’s visualisations are sometimes a bit more abstract, showing ownership and jurisdiction rather than the physical location.
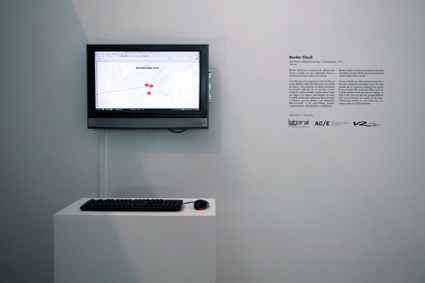 Installation at Laboral
How does a particular country’s laws and practices regarding data affect the path adopted? Do you have examples?
It is not necessarily the case that a state’s laws and practices affect the route, rather that the route determines which states’s laws and practices one is exposed to.
The internet is routed passively, that is to say, there is no way you can tell your data how it should reach its destination. The internet is designed in such a way that data will always try to find the fastest route available, and that may happen to take your data through countries like the UK that monitor all passing data.
In this sense the route is often more influenced by geography and money. Geography, because some places such as the the UK’s West Coast act as a ‘funnel’ for submarine cables, since they are the first stop for many of those cables when they cross the Atlantic. Money, because richer countries will also have the faster infrastructures and those get a preference when it comes to routing.
Laws and policies can influence where companies set up their offices and data centres though. Facebook for example serves non-US users from Ireland, because of the low taxes it pays there. However, the fact that Facebook is registered in Ireland also means it has to comply with EU privacy laws. A funny example of what that means concretely is a 2011 ‘meme’ that spawned on reddit where European users flooded Facebook with data requests, something that was not possible for American users of Facebook.
What were the most surprising discoveries you made while testing the data travels?
One of the more interesting things I’ve realised and which is something that I would like to follow up on is how ‘historical’ the networks actually are. If you compare maps of the submarine cables that make up contemporary intercontinental fibre optic networks with maps of telegraphy networks of the 19th century you will see a lot of similarities.
However, this historical element also became apparent to me using Border Check when for example I found out that much of Latin America is predominantly connected through the Telefonica network. Telefonica is a very large telecommunications company that resulted from the privatisation of Spain’s state telecom company.
In this sense one could argue that a lot of Latin American countries are dependent on the telecommunications infrastructure of their former coloniser. This could lead to clashes of interest. In the case of Brazil this has recently become apparent when, in response to NSA spying, Brazillian president Dilma Rousseff announced plans to build a national Brazilian telecommunications infrastructure. There Rousseff wants to ensure that Brazil no longer needs to route via the United States (that is the Telefonica network) and as a consequence be subjected to American monitoring when it connects with the rest of the world.
How do you retrieve the information necessary to map these travels?
While you run Border Check it uses your browser history in order to detect whether you are loading a new website. It then relies on Layer Four Traceroute, which is a tracerouting software, to map the ip addresses of the machines that route your data on it’s way to that destination website. Border Check then uses Maxmind‘s free GeoIP databases to link these adresses to cities, countries and companies. Maxmind to some extent gets this information from repositories of internet registries (organisations that keep track of who registers what website, who owns a certain ip-adress etc). For visualisation Border Check uses Openstreetmap with the leaflet visualisation library.
What’s next for BC?
I am really interested in adding more information layers to Border Check that provide some more context on what it could mean when one surfs through a specific country. One of the initiatives I find exciting is www.diriwa.org. It tries to collaboratively map communications and informations rights in the world. I think adding this sort of information will make Border Check much richer. Other than that, releasing updates that would make the software more easy to install and run on different platforms.
Thanks Roel!
Border Check was sponsored by V2_ and developed during a residency at LABoral, within the context of Summer Sessions 2013.