
Amanda McDonald Crowley from Eyebeam had invited inspiring artists and designers for a Conflux panel to discuss the visualization of environmental data and their potential to foster social change.
 The event also launched Eyebeam’s Ecovisualization Challenge, a competition to heighten environmental awareness through creative data visualization projects. Group sign-ups will coincide with the panel, and the challenge is scheduled to run from October-November, 2007. Winning projects will be included in Eyebeam’s upcoming exhibition focusing on environmental and sustainability issues.
The Eco-vis Challenge invites artists to collaborate with technologists and redefine what the future of tracking and visualizing the environment could be.
The competition is two-fold:
– an eco icon contest to design a graphic that can be used for tattoo, stickers, etc to make visible environmental/ecological concerns. Deadline is Nov. 5th.
– an Eco-Vis that brings to life ecological information that is not necessarily obvious. Deadline is December 8.
First panelist, Tiffany Holmes focused on her project 7000 Oaks And Counting. The goal of this eco-visualization research is to show that daily visual feedback can elevate understanding of consumption patterns and possibly increase conservation behavior in resident populations.
 The project makes use of the existing building control system typically found in large institutional buildings. These systems provide central management and monitoring for air conditioning control, lighting control, and electrical and chilled water status monitoring, as well as providing energy management services. Typically, data from such systems is available only to a select audience of engineers and facilities personnel. The eco-visualization software focuses on the electricity consumption and its purpose is to make the data accessible and easy to understand for everyone through a website, a kiosk animation and a model tree sculpture. Ultimately, Holmes hopes that the project will stimulate people to adopt a more eco-conscious behaviour.
Tiffany Holmes is aware of both the advantage and challenges of any eco-viz experiment:
– on the plus size: dynamic feedback can be very motivating; potential to reach a broad audience, re-visualization of an old problem using new technique can re-vive an old discussion,
– minus points: no way to engage the accuracy of a given asset, difficulty to reach broader audience, sometimes users are asked to install a custom software which might put off some of them.
She ended her talk by recommending everyone to read her blog, Ecoviz.
Next came Michael Mandiberg with a presentation of his projects: Oil Standard and Real Costs.
Oil Standard is a web browser plug-in that converts all prices from U.S. Dollars into the equivalent value in barrels of crude oil.
When you load a web page, the script inserts converted prices into the page. As the cost of oil fluctuates on the commodities exchange, prices rise and fall in real-time.
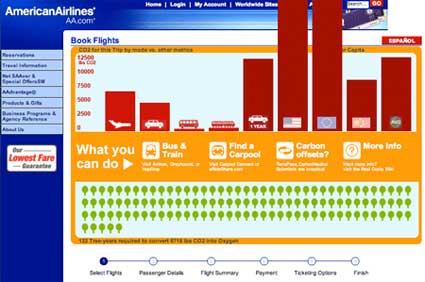 Real Costs is a Firefox plug-in that inserts emissions data into travel related e-commerce websites. The first version adds CO2 emissions information to airfare websites such as Orbitz.com, United.com, Delta.com, etc. Following versions will work with car directions, car rental, and shipping websites. Think of it like the nutritional information labeling on the back of food… except for emissions.